Microbial genomics is a high-throughput OMICS-based technique that entails the study of the genomic sequences of microorganisms. Research in microbial genomics has provided us with many insights on microbiome functioning, and refinements to perturbation methods to ultimately improving both human and animal health.1
The ability to provide comprehensive insights on pathogen identity, diversity, and evolution is invaluable in modern infectious disease research, and has profound implications for the development of vaccines.
Due to the several benefits of OMICS-based technologies, analysis and interpretation of omics data for understanding the spread and evolution of pathogens is increasingly important for vaccine development. As more and more variety of omics data is being generated, a number of tools have been developed to process the data from quality checking to downstream analysis. This brings both experimental as well as computational challenges in acquisition and analysis of data2. Thus, we urgently need bioinformatics workflows that leverage the existing tools and are tailored to business requirements.
Here, we summarize a few approaches to analyze the pathogen evolution from microbial genomics data and highlight our experience and expertise in implementing them in workflows.
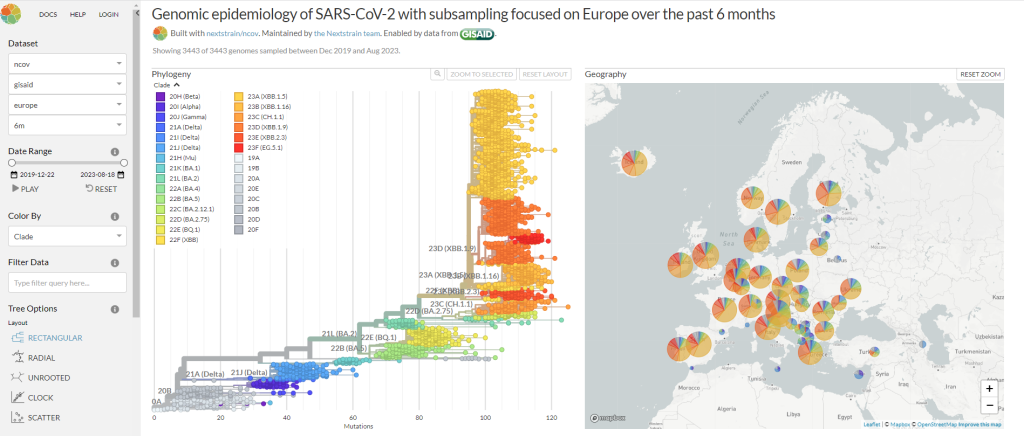
Figure 1: NextStrain’s dashboard based on publicly available SARS-COV data (Adapted from https://nextstrain.org/ncov/global)
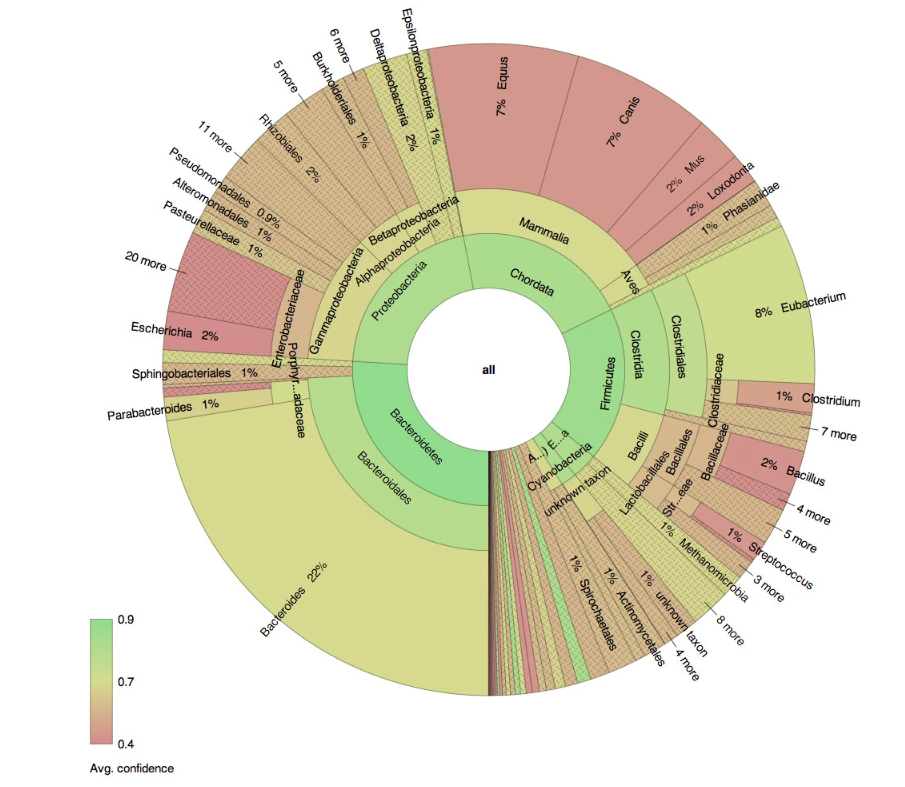
Figure 2: Exemplary interactive visualization performed on microbial genomics data (Source: Interactive visualization of taxonomic classification in Krona)
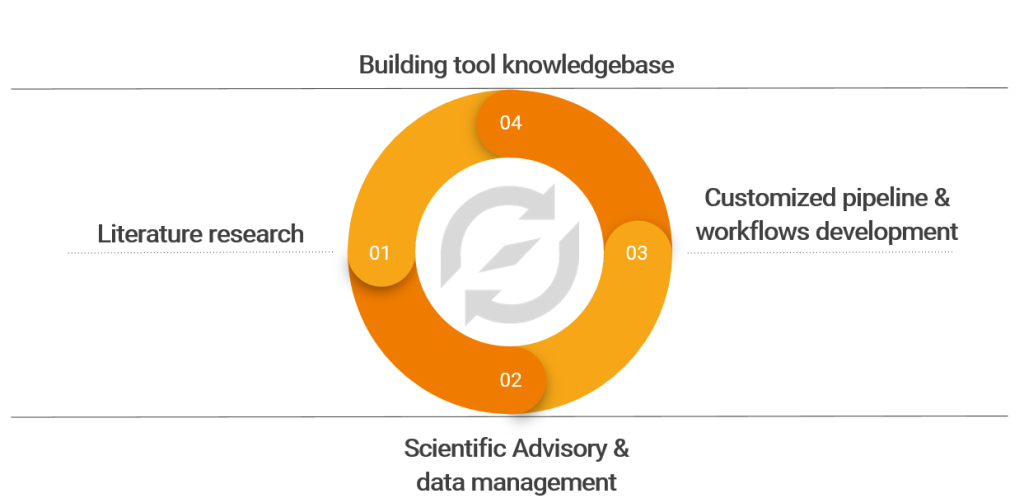
Figure 3: Our expertise and learnings to boost vaccine development initiatives
How can OSTHUS support you in your vaccine development initiatives?
Contact us to get the details on how we are helping our customers in accelerating their vaccine development programs.
Disclaimer
The contents of this blog are solely the opinion of the author and do not represent the opinions of PharmaLex GmbH or its parent Cencora Inc. PharmaLex and Cencora strongly encourage readers to review the references provided with this blog and all available information related to the topics mentioned herein and to rely on their own experience and expertise in making decisions related thereto.
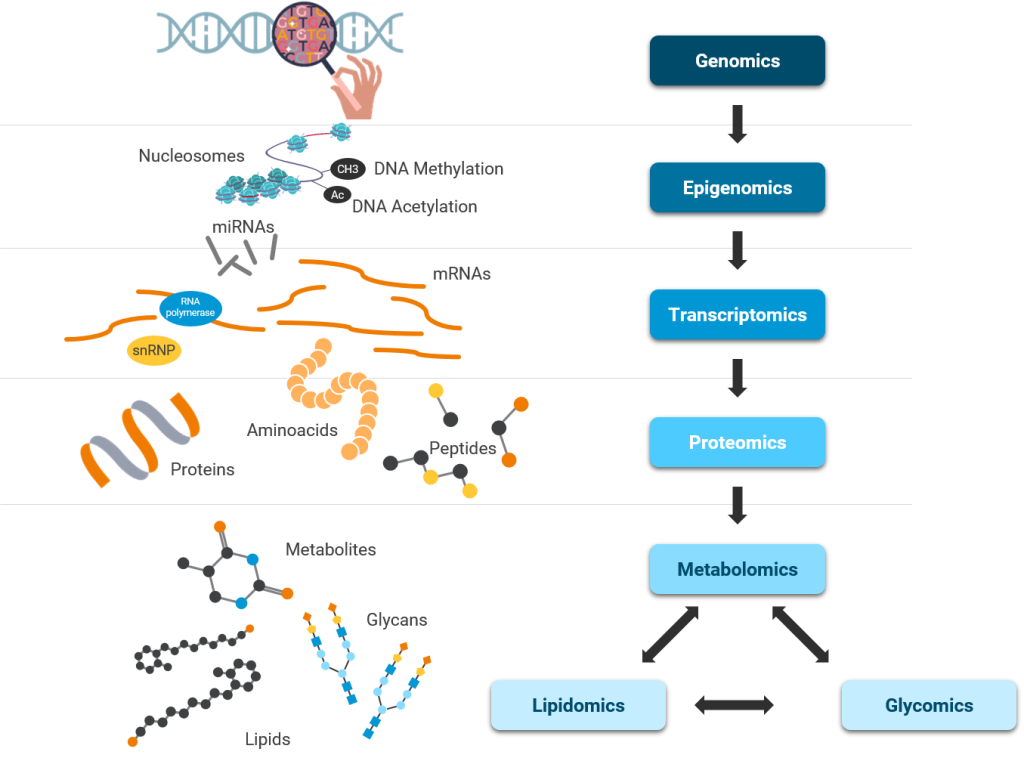
Several scientific and technological advances uncovered new knowledge about each step in central dogma – unidirectional flow of information from DNA to RNA to Proteins and in many cases from RNA to Proteins. Simultaneously, these advances discovered epigenetic regulation of central dogma and the importance of probing other biomolecules such as lipids and metabolites.
Due to rapidly evolving technologies and the reducing cost of generating OMICs data – quantitative high throughput data on biomolecules, we require specific tools to analyze it rapidly. Data analysis is a key factor in R&D processes due to the increasing resolution of these measurements in spatio-temporal dimensions from organism to tissues and even to individual cells. This is also evident from the large investments OMICs data attracts across the R&D industry and academia.1 In Jan 2023, EU launched a joint program worth 16.5 million euros for large scale analysis of OMICs data for drug-target finding in neurodegenerative diseases alone.
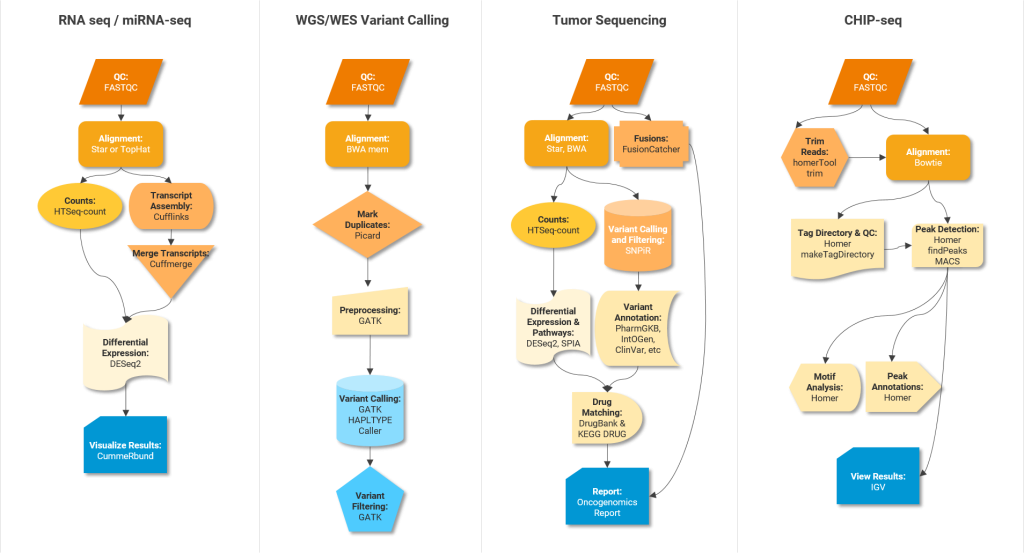
Scientific workflows or pipelines (Figure 2) – series of software tools working in a stepwise manner one after the other – are important to rapidly analyze and interpret vast amounts of data generated using various OMICs techniques. For example, RNA-seq data analysis (Transcriptomics) involves trimming, aligning, quantification, normalization and differential gene expression analysis where output of one tool serves as input for the next tool in the workflow. Permutations of these tools can lead to over 150 sequential workflows or pipelines, so reproducing and comparing their results can be challenging2.
Below are some examples of pipelines and software tools to perform different analysis steps in different OMICs experiments.
Integrative frameworks can help facilitate the execution of these pipelines. Typical no/low code frameworks for non-programmers are Galaxy, Unipro UGENE NGS and MIGNON. For developers, suitable analysis frameworks include Snakemake, Nextflow and Bpipe. Community driven platforms like nf-core provide peer-reviewed best practice analysis pipelines written in Nextflow.
One way to ensure efficient/streamlined R&D is to establish and follow standard practices for OMICs data analysis. Figure 2 shows gold standard software tools for performing various intermediate steps in different OMICs data analysis pipelines. Standardized OMICs practices – tools and frameworks – will facilitate accessibility (A in FAIR) and reproducibility of high quality results. It will also enhance their business value (please also refer to the following blog post: Multi-Omics Data Integration in Drug Discovery). We would like to point to the analysis pipelines for major OMICs assay types developed by the ENCODE Data Coordinating Center (DCC).
Although uniformity is valuable in OMICs data analyses, customization is also equally valuable for specific scientific contexts. Different OMICs experiments require different handling of the data and analyses. For example, high variation in signal-to-noise ratio in ChIP-seq experiments to identify transcription factor (TF) binding sites necessitates a wide range of quality thresholds. RNA-seq data analyses are driven by factors such as read size, polyadenylation status, strandedness and require different parameters or settings. Hence, there are multiple “generic” factors that can be standardized, while individual parameters and settings can be customized to suit specific scientific questions.
Relatively well-established OMICs data generation techniques demand standardized ways of data analysis while allowing customization necessary for a specific scientific context. To accelerate discovery and actionable data-driven decisions within your organization, take a step closer to FAIR OMICs data by establishing gold standard workflows and frameworks for OMICs data analyses.
Contact us to know more about how we are instrumental in our customers’ goal
to derive scientific insights from their OMICs data.
Disclaimer
The contents of this blog are solely the opinion of the author and do not represent the opinions of PharmaLex GmbH or its parent Cencora Inc. PharmaLex and Cencora strongly encourage readers to review the references provided with this blog and all available information related to the topics mentioned herein and to rely on their own experience and expertise in making decisions related thereto.
The first complete gapless human reference genome was published in 2022 (draft genome that was published in 2003 was incomplete) by Telomere-2-Telomere consortium – discovering 200 Million more base pairs and 1956 new gene predictions in the process2. It unlocked further potential for functional studies to find new therapeutic targets.
Multi-omics (also called Panomics or integrative omics) is the integration of omics data sets arising from the subfields such as genomics, transcriptomics, proteomics, metabolomics; aimed at increasing our understanding of biological systems3. As the pharmaceutical industry is increasingly embracing the era of precision medicine, the fast-paced omics technologies are becoming the significant driver in this transformation journey. However, as per our experience in the field, gaps remain with respect to data integration, data harmonization, design considerations, and data management strategies for realizing the full potential of omics data.
Genomic databases like GenBank and the Sequence Read Archive (SRA) collectively hold 100+ petabytes of data and are predicted to exceed 2.5 exabytes by 2025. Collecting, integrating, and systematically analyzing heterogeneous big data with distinct characteristics are a challenging task that may lead to data mismanagement. For instance, DNA sequencing data often comes from various platforms like Illumina, Pacific Biosciences, and Oxford Nanopore, each producing data with unique quality thresholds and file types. One specific issue involves the use of multiple identifiers. A protein can have several identifiers depending on the database used, such as UniProt, PDB, or internal source systems. Discrepancies in mapping these identifiers may lead to confusion or misinterpretation of results arising from multiple systems, hindering the downstream data analysis.
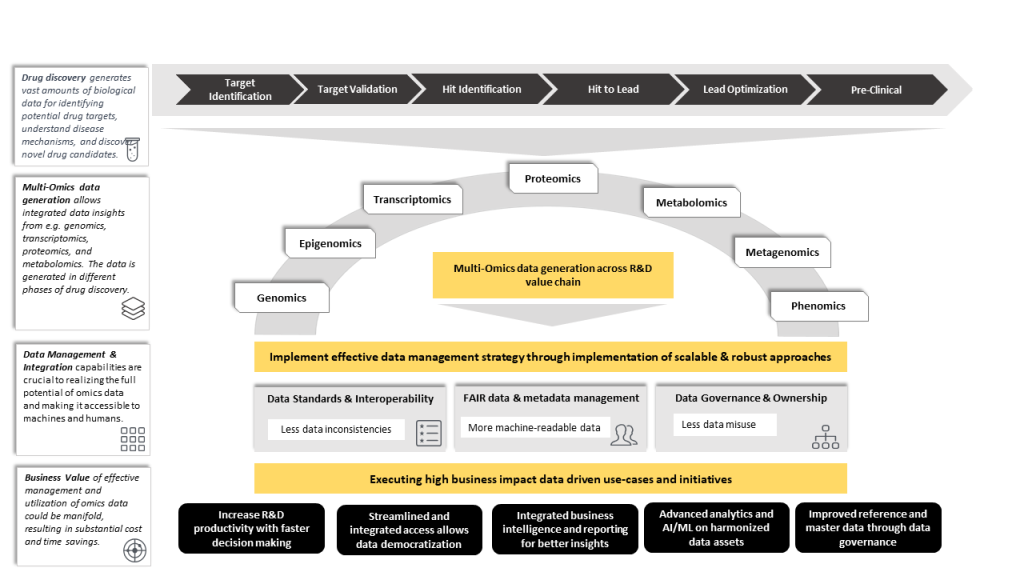
Figure 1: Illustration of our understanding and approaches for leveraging multi-omics data
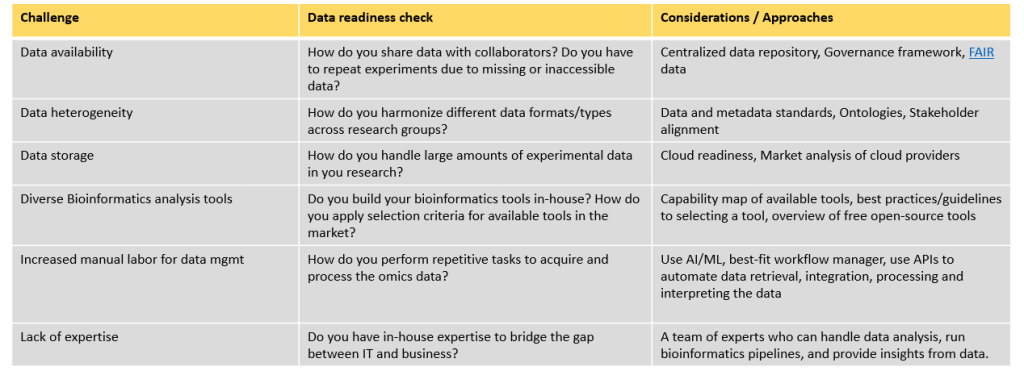
Figure 2: OSTHUS’ exemplary approaches and considerations to certain challenges in omics data management
How can OSTHUS help?
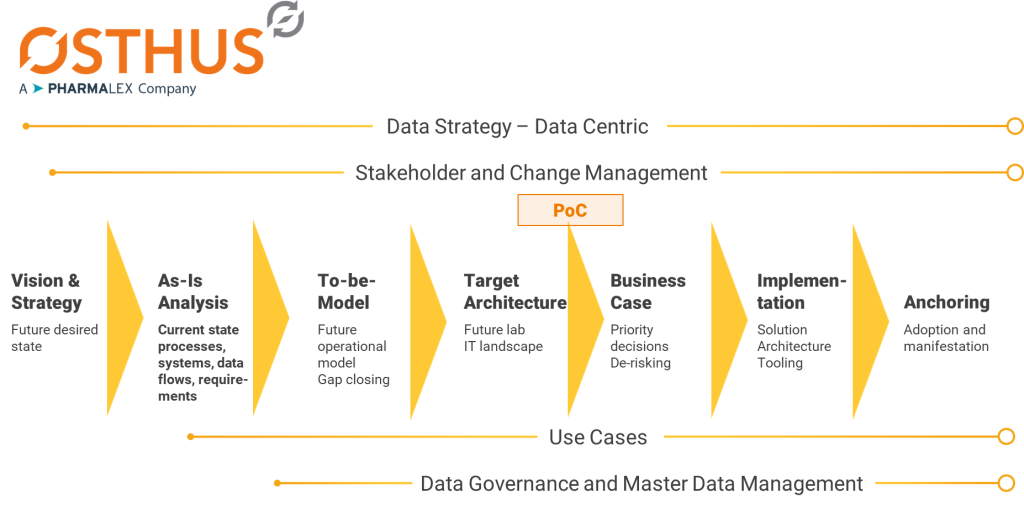
Figure 3: OSTHUS consulting approach from vision to implementation
In our recent project, a pharmaceutical company was struggling with efficiently managing their genomic and protein sequence data. We are implementing a bespoke cloud-based centralized data lake solution that not only consolidates different data and metadata but also offers an intuitive user-interface that provides ability to quickly extract insights from similar sequences in in-house as well as publicly available resources.
OSTHUS offers end-to-end services from vision and strategy, to market analysis, to implementation. Recognizing that one size doesn't fit all, we offer technology agnostic consulting. Our Bioinformatics experts understand the available technologies and their strengths as well as weaknesses, from open-source solutions to commercial offerings, which allows us to recommend and implement the best-fit solution that caters to specific objectives.
To realize the full potential of these approaches and transform raw omics data into meaningful insights, a strategic and robust data strategy is critical.
With strategic planning and expert guidance, these challenges can be effectively managed, unlocking the immense potential of integrated omics data for accelerated drug development.
Contact us today to revolutionize your bioinformatics journey and empower data-driven decision-making in your drug development efforts.
OSTHUS GmbH is a subsidiary of AmerisourceBergen Corporation. OSTHUS GmbH and AmerisourceBergen strongly encourages readers to review all available information about the topics contained in this blog and to rely on their own experience and expertise in making decisions related thereto.
Not all data is created equal. Understand the different levels of data quality and how they can influence your organization.
In the race to leverage data as a valuable asset to the enterprise, we are constantly balancing the need for immediate access with the need to refine the information as much as possible. Ideally, we would like to extract the real nuggets of gold from our data, the ones that give us important strategic insights. However, it is also natural (and necessary!) to handle data at various stages of refinement on our way there.
So what does data look like at different levels of quality?
A useful way of thinking about data quality is by splitting it into three distinct levels:
While many organizations have data at both ends of the spectrum, moving as much data as possible to the gold level (i.e. improving its quality) is a goal that will pay dividends for years to come. To do so, we rely on a number of strategies:
Once data transitions to a gold-level status, it offers some additional advantages to the organization. For instance, gold data has a high level of accuracy, which means that it can be used as a trusted input for training machine learning models and business intelligence tools. These techniques allow businesses to better understand their current state and to create segments for current behavior or forecasts that help inform decisions about the future.
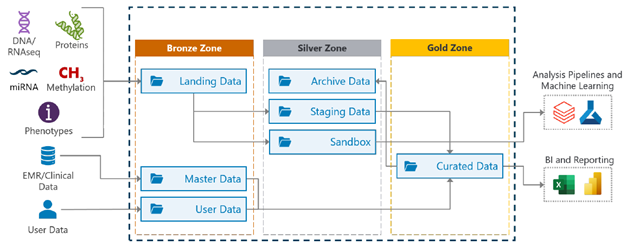
As we can see, the data across the organization is handled and accessed by multiple user groups with varied needs. The question then becomes: how can we effectively store these heterogeneous data categories into a single, unified repository?
A potential answer is to employ a Data Lakehouse, which is a flexible repository that combines the scalability of a Data Lake with the solid integration power of a Data Warehouse. A Data Lakehouse has the advantage of allowing data to be organized in layers, which can be directly mapped to the bronze, silver, and gold quality categories above.
This will close in 0 seconds